


Running an ABA clinic in 2025 means more pressure than ever: workforce shortages, reimbursement scrutiny, and capacity lost to inefficiencies. If you're a clinic owner, BCBA, or operations lead, you might be losing money because of no-shows, late paperwork, denials, staff turnover, or unpredictable workloads. This guide gives you the tools, key metrics, and a 90-day plan to spot problems and improve workforce operational efficiency across your team.

Diagnose Your Baseline (10 Minutes)
Before making changes, you need solid metrics. Spend ~10 minutes collecting data across your team and clinic. Use these KPIs, formulas, and “good / better / best” ranges as starting targets. Then build a simple 1-page scorecard to track them.
*These “good/better/best” ranges are illustrative; adjust based on your clinic’s size, geography, payer mix, and past performance.
1-Page Scorecard Template (to track weekly & monthly):
- Clinic-wide Utilization for RBTs / BCBAs
- Scheduled vs Delivered Sessions (attendance)
- Documentation Lag (avg & % beyond 24h)
- First-Pass Claim Rate
- DSO
- Staff Turnover / PTO Spike Events
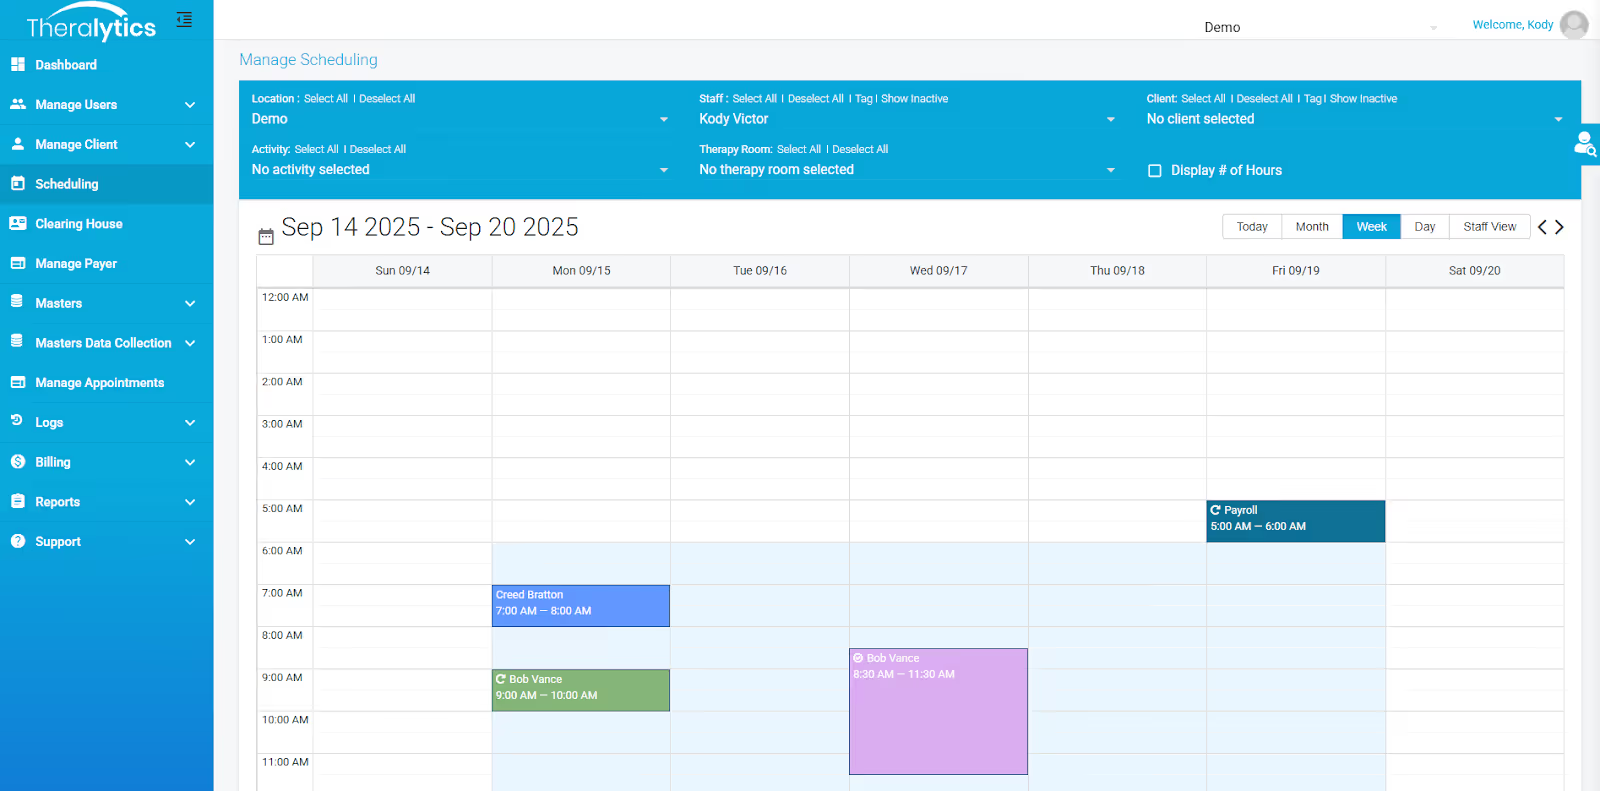
Scheduling That Actually Lifts Capacity
Build a Capacity-First Template
- Map therapist constraints: For each staff member, list their available hours, commuting or travel constraints, specific competencies or training (which clients they can serve).
- Weekly template with buffers: Carve out time in the schedule for documentation, travel (if delivering services off-site), breaks, and supervision. Don’t overload slots back-to-back without recovery time.
- Cluster routing: If staff travel to multiple sites/homes, group appointments geographically so you minimize travel “windshield time.”
Fill-Rate Tactics That Work
- Maintain a waitlist + on-call pool: when slots open (due to cancel or no-show), have qualified subs who can be slotted in.
- Auto-backfill rules: For example, if a cancel happens more than X hours ahead, trigger a backfill; if last minute, have a “same-day hold” system.
- Reminders & cancellation protocols: SMS or automated reminders; clear policies for late cancellation or no-show fees (where allowed).
Measure & Iterate Weekly to Improve Workforce Operational Efficiency
Set up a mini dashboard that tracks:
- Template Fill Rate (how many sessions slots are filled vs plan)
- Backfill Rate (%)
- Travel Time % (hours spent traveling ÷ total service delivery hours)
- Overtime % (especially if OT is driven by last-minute fill or cancel)
- Late-Cancel Recovery Time (how much revenue you recover via backfills, make-ups)
Try using scheduling tools or software with features like location filtering, travel time estimates, and flexible time slots. (More on tools below.)
Supervision & Compliance Guardrails (Don’t Break These)
- RBT Ongoing Supervision Minimum: The BACB mandates at least 5% of an RBT’s total monthly service-delivery hours must be supervised.
- For example, if an RBT provides 100 direct service hours in a month, they need ≥ 5 hours of supervision.
- At least two synchronous contacts per month; at least one direct observation.
- Keep fully up-to-date with the 2025 BACB handbooks and policies to catch any regulatory or procedural changes. (For example, how remote supervision counts, record-keeping, etc.)
- EVV (Electronic Visit Verification): Whether ABA is subject depends on state & type of service (For example, PCS or Home Health). Always confirm via state Medicaid/payer policy. For example, some states exclude ABA from EVV requirements.
Team Workload, Burnout & Retention - Turn Data into Design
Turnover is notoriously high in ABA, especially among RBTs. Many clinics lose capacity not because of lack of clients, but because of burnout and unpredictable schedules. To improve retention:
- Fixed templates: predictable weekly schedules so staff know when their travel, documentation, and off hours are.
- Fair territory sizing: distribute travel or home-based routes equitably so no one has disproportionate “windshield time.”
- Mentorship / development time blocks: schedule supervision/mentoring as part of the workload, not extra.
- PTO / time-off planning windows: firm windows for requesting PTO; limit last-minute unplanned work except in real emergencies.
- Clear cancellation / lateness policy: both for clients and staff. Transparent policies help manage expectations and reduce frustration.
Documentation, Quality, and Speed
- Standardize note templates/types. Use timers or time stamps for session start/stop. Set expectations: For example, all notes signed within 24 hours, ideally by end of day.
- Use mobile data capture or field-friendly tools so therapists can document while traveling or immediately post-session. Auto-promptments (For example, reminders if a note has not yet started or is half-filled) help.
- Avoid “Friday pile-ups”: monitor volume of open notes as week progresses; possibly enforce “no more than X open” at any time.
- Chart audits: pick at least 10 charts/week (or a sample % if large) to audit for completeness, medical necessity, consistency. Feed results back to staff.
Revenue Protection: From Authorization to Cash
Keeping a clean and efficient revenue cycle is crucial; inefficiencies here bleed money.
Front-end Accuracy
- Always verify authorizations & their limits (hours, duration).
- Confirm correct place-of-service codes, provider credentialing, and whether EVV or other state/payer mandates apply.
- Keep an updated matrix per payer: what documentation they require, submission rules, etc.
Clean Claims & Quick Resubmits
- Target 95%+ first-pass claim acceptance. If you're below, look at root causes (wrong codes, missing modifiers, mismatched documentation).
- Implement daily or frequent work queues (WQs) for claims that failed or were rejected so resubmission is prompt.
A/R Workflow
- Establish a cadence for follow-ups — for example, 7, 14, 30-day touchpoints depending on payer complexity.
- Build a “denial reason” dashboard: which payers deny most, which reason codes, what % of dollar value is held up.
- Align operations, clinical, and billing teams so that documentation issues causing denials are fed back into training and schedule design.
Tooling That Helps (Where Theralytics Fits)
When choosing or optimizing platforms, consider:
- Scheduling + routing features: location-based filtering, travel time built in, flexible templates.
- Billing & documentation: ability to capture mobile or remote sessions, integrate auths, code libraries, auto-prompts.
- Reporting & analytics: visibility into utilization, claim acceptance, DSO, attendance, staff workload.
Theralytics (as one example) offers: scheduling with mileage/location filtering; flexible billing and mobile workflows; strong reporting/analytics for utilization visibility and documentation speed. If you have Theralytics, ensure you use all those features. If not, your tool should support similar capabilities.
30/60/90-Day Implementation Plan
Here’s an actionable plan to roll out efficiency sprints. Adjust according to your size and resource level.
Conclusion
If you run through this playbook with discipline over 90 days, you’ll uncover and address many of the common operational leaks that ABA clinics suffer: under-utilized staff, revenue losses, compliance risks, and burnout. The key is tracking the right metrics, building resilient templates and supervision systems, and iterating based on real data.


.avif)