


Frequency data collection ABA is one of the most widely used, and sometimes misunderstood 4measurement methods in applied behavior analysis. Done well, it provides precise, actionable data for clinicians to base treatment decisions on. Done poorly, it can mislead teams or bog down staff with unnecessary complexity.
This guide walks you through definitions, workflows (paper & digital), calculations, IOA examples, and tools with practical takeaways and Theralytics-specific solutions to make frequency tracking effortless.
What is Frequency Data Collection in ABA?
In ABA, frequency refers to the number of times a behavior occurs. But here’s the catch: “frequency” is sometimes used interchangeably with count and rate.
- Count = raw total of occurrences (e.g., “Johnny raised his hand 12 times”).
- Rate = occurrences standardized by time (e.g., “12 per 60 minutes = 0.2 per minute”).
In this article, we’ll use frequency = count and rate = normalized by time.
When to Use Frequency/Event Recording
Best for behaviors with:
- Clear start/stop points (hand raises, instances of aggression, vocal requests).
- Short to moderate durations.
Not ideal for:
- Continuous, extended behaviors (e.g., tantrums lasting 20 minutes → use duration recording).
Quick Comparison Matrix
Frequency Data Collection vs Other Measurement Methods
Here’s a decision snapshot:
- Frequency/Rate: High precision; works best for discrete behaviors.
- Duration: Captures sustained behaviors.
- Latency: Good for prompt/follow-through analysis.
- Interval/Time Sampling: Works for multiple behaviors or high-rate situations where frequency is impractical.
Step-by-Step: How to Collect Frequency Data in ABA (Paper & Digital)
Paper Workflow
- Tally marks in boxes or on data sheets.
- Reset points (every minute or 5 minutes) to keep data clean.
- Session total at end, convert to rate if needed.
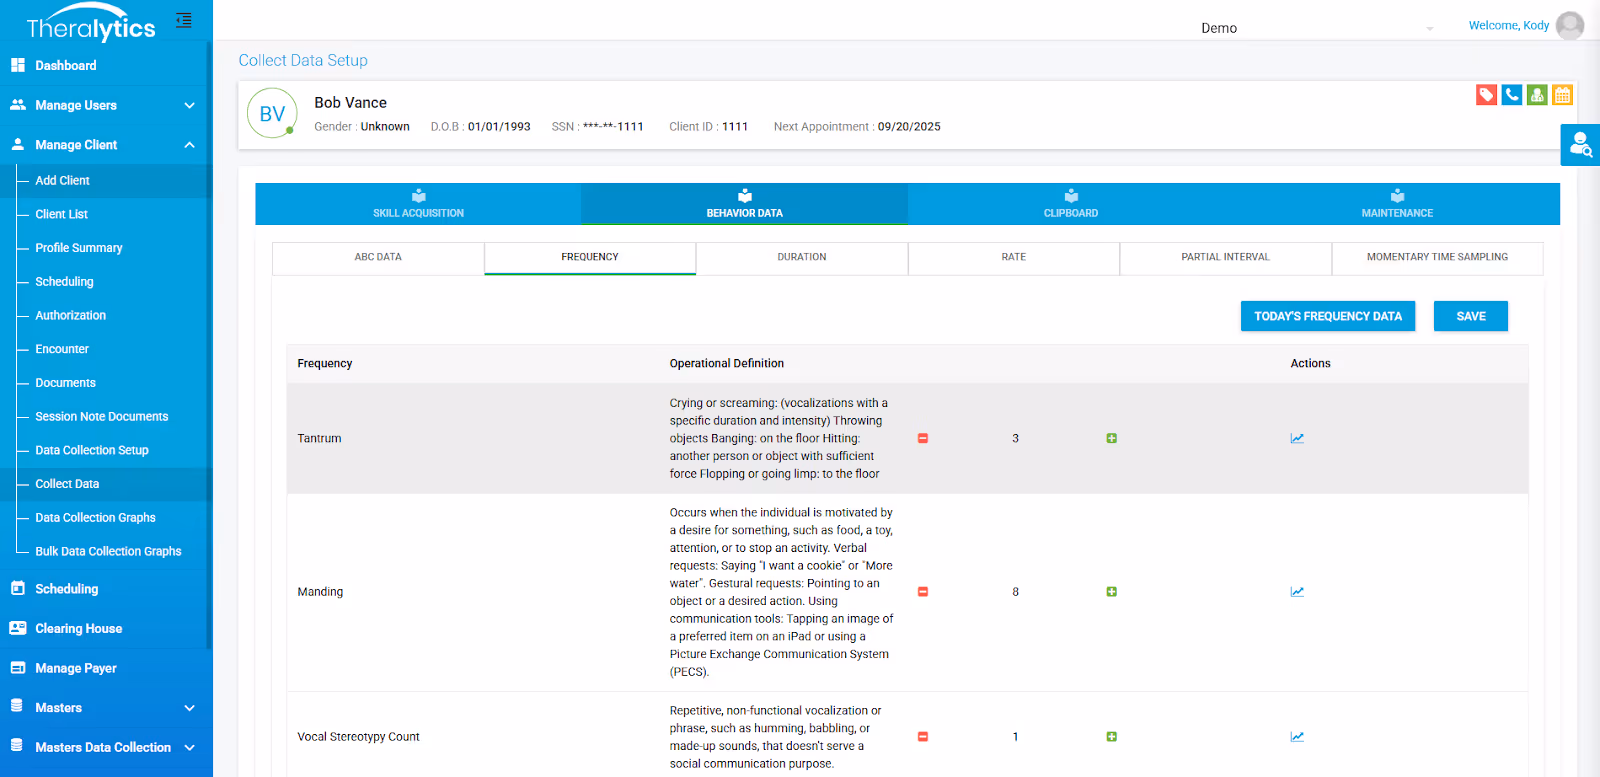
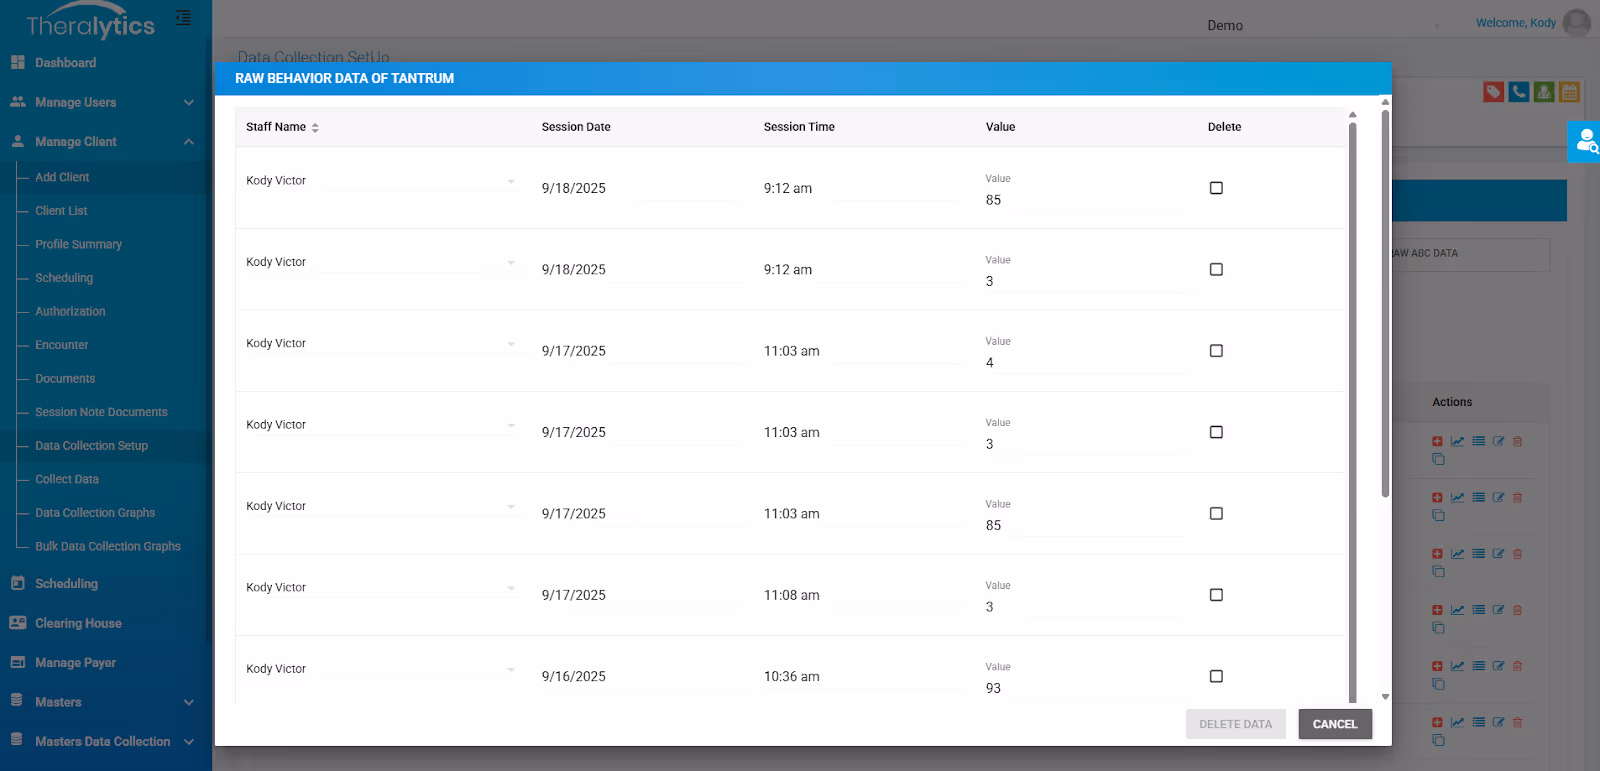
Digital Workflow
- Real-time taps for instant logging.
- Timestamps automatically saved.
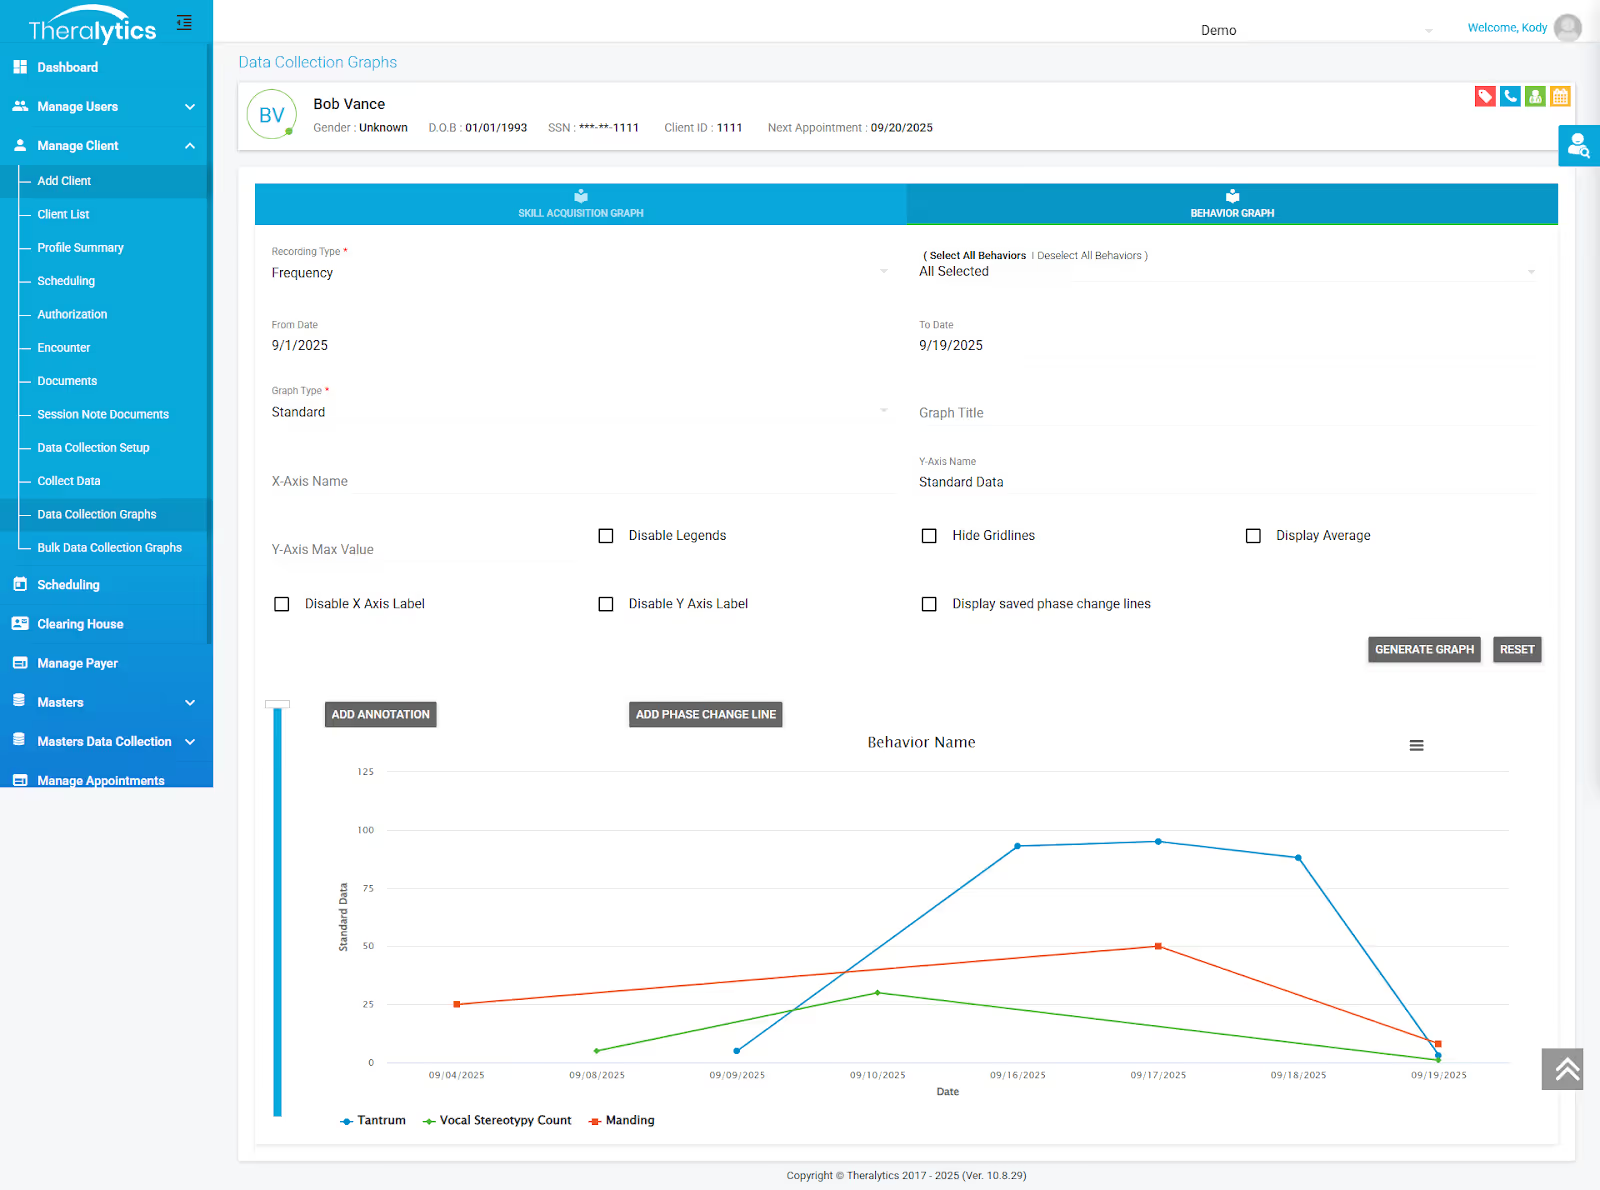
- Graphs generated instantly , no manual math.
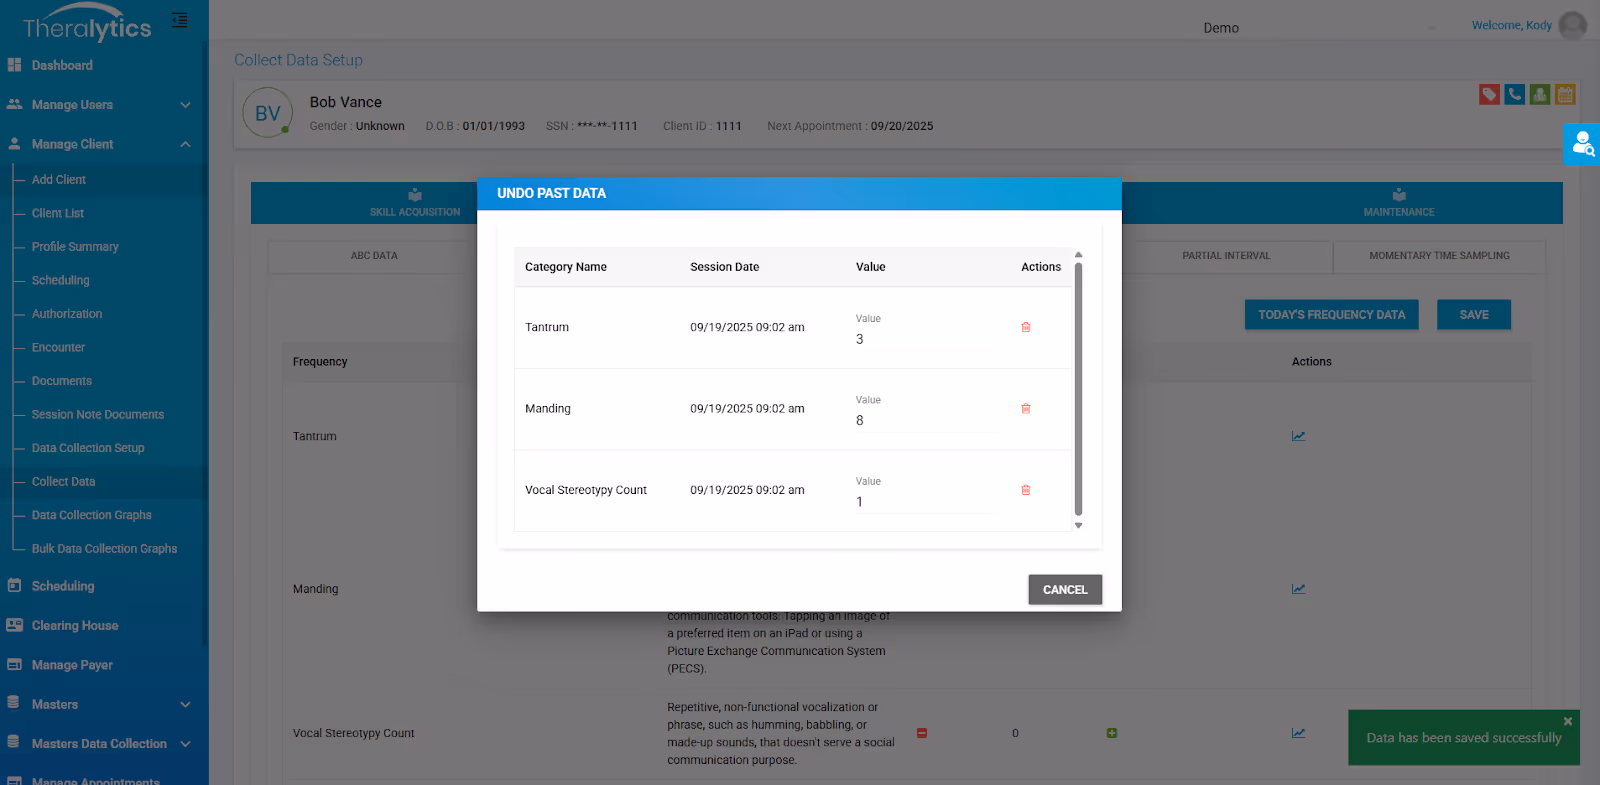
How Theralytics Helps
- One-tap green “+” to log, red “–” to retract.
- Custom frequency sheets for each learner.
- Interval timers for partial, whole, or MTS recording.
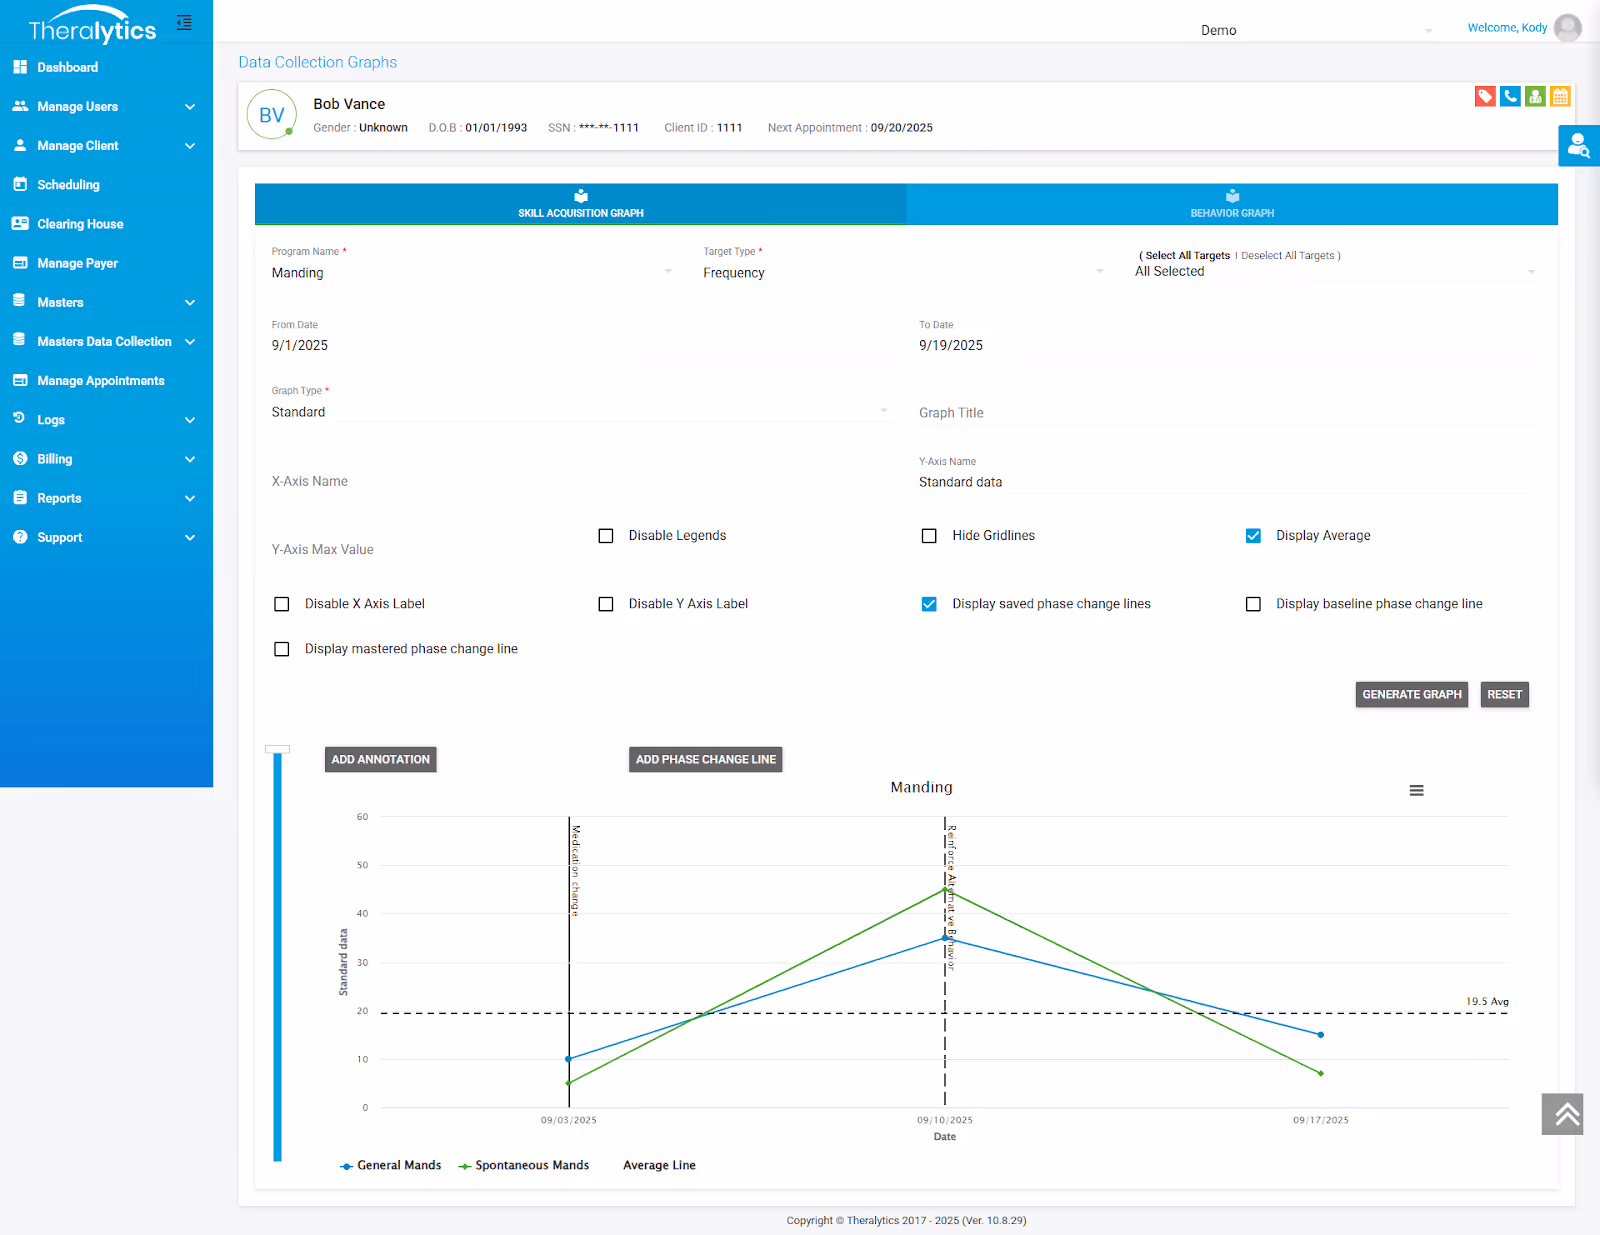
- Instant phase-change lines and graphing.
- Live session tracking with exports.
Special Cases:
- Bursts of behavior → tally clusters, compute rate.
- Group settings → separate sheets per learner.
- High-rate behavior → switch to interval or rate reporting.
How to Calculate & Normalize Frequency Data (Worked Examples)
1. Converting Count to Rate
To make data comparable across sessions of different lengths, convert raw counts into rates.
Formula: Rate = Count ÷ Time
Examples:
- 12 hits in 60 minutes = 0.2 hits per minute
- 18 requests in 30 minutes = 0.6 requests per minute
2. Inter-Response Time (IRT)
IRT shows the average time between behaviors.
Formula: IRT = Session Time ÷ Count
Example: 30 minutes ÷ 15 requests = 2 minutes per request
3. Session Normalization
Raw counts can be misleading if sessions vary in length. Always convert to rate (for example, per minute or per hour) so data can be compared fairly across different sessions.
4. Graphing Options
- Cumulative graphs show overall skill acquisition over time.
- Per-session graphs highlight day-to-day performance and consistency.
IOA for Frequency Data - Methods & Worked Calculations
Interobserver Agreement (IOA) ensures reliability.
- Total Count IOA:
Smaller CountLarger Count×100Larger CountSmaller Count×100
Example: Obs A = 12, Obs B = 15 → 12/15 × 100 = 80%.
- Mean Count-per-Interval IOA:
Split session into intervals, compare counts, average agreement. - Exact Count-per-Interval / Trial-by-Trial:
Highest rigor, requires exact match per trial. Best for discrete trials.
Graphing Frequency Data - What to Graph & Why
- Raw counts = quick snapshots.
- Rates = standard comparisons across sessions.
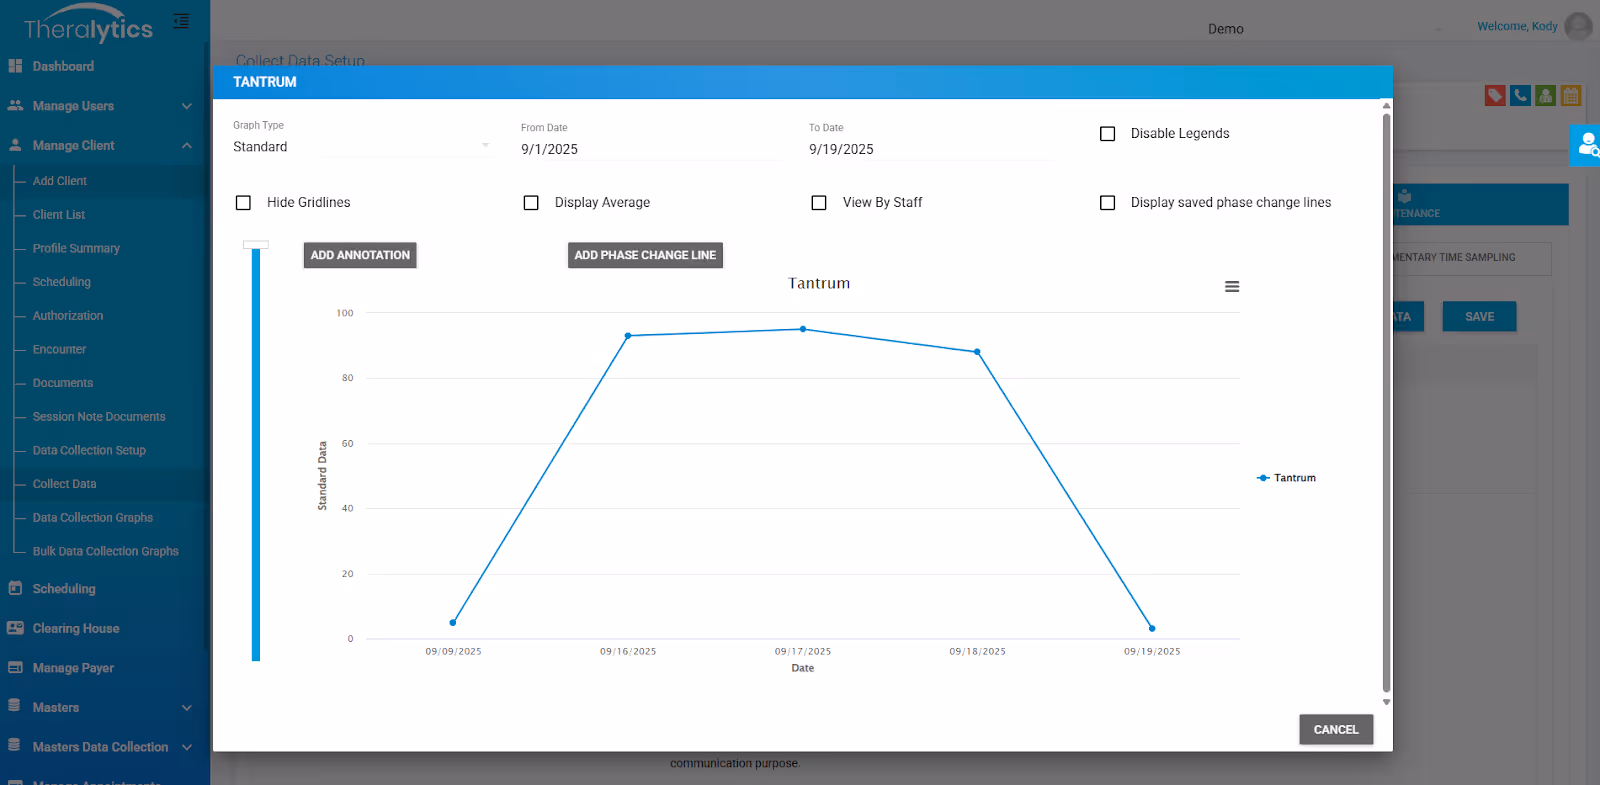
- Cumulative records = skill acquisition trajectory.
- Use vertical phase change lines to mark intervention changes.
Troubleshooting Real-World Problems
- Double-counting → Define behavior, train staff.
- Bursts/high-rate → Use interval recording.
- Recording Multi-topography → Different data sheets per behavior to capture all relevant details to appropriately analyze data.
- Group settings → Assign behavior codes per learner.
- Missing timestamps → Use digital tools with autosave.
- Reactivity → Train staff to record discreetly.
- RBT differences → Calibration sessions & IOA checks.
Theralytics - How a Modern ABA Platform Streamlines Frequency Data Collection
- One-tap frequency logging with +/– buttons.
- Custom data sheets for each program.
- Interval timers for partial/whole/MTS.
- Interactive graphs with instant phase-change lines.
- Exports (CSV, PDF) for team review.
Theralytics transforms frequency recording from a manual chore to a real-time, insight-driven workflow.
Conclusion / Next Steps
Frequency data collection ABA doesn’t have to be complicated. With the right workflow, calculations, and tools, clinicians can capture behavior accurately and make better decisions.
- Download your free frequency data sheet, IOA calculator, and interval planner.
- Explore how Theralytics simplifies the process with real-time digital data collection.
Book a Discovery Call with Theralytics to see it in action.
FAQs
Is frequency data collection in ABA the same as rate?
Not exactly. Frequency refers to the raw count of how many times a behavior occurs (e.g., 12 hand raises). Rate is that count divided by time (e.g., 12 in 60 minutes = 0.2 per minute). Rate is often more useful for comparing sessions of different lengths.
How do you calculate rate?
To calculate rate, divide the total count of a behavior by the session length. Example: 20 occurrences in a 40-minute session = 0.5 per minute. Rate helps standardize data across sessions.
What IOA is best for frequency?
For frequency data collection, Total Count IOA is the simplest method. However, Exact Count-per-Interval IOA or Trial-by-Trial IOA provide the highest rigor, ensuring that both observers recorded the exact same number of responses.


.avif)